
Uma parceria entre universidade alemãs resultou no mapeamento das proteínas associadas à sinapse neuronal, mais precisamente a visão da terminação do neurónio pré-sináptico. As informações foram obtidas pelo grupo através de homogeneizados de cérebros de ratinho, seguindo-se um processo de purificação dos sinaptossomas. Posteriormente recorreram a Western Blot quantitativo para medir a quantidade de cada uma das proteínas e ser possível inferir acerca da sua quantidade relativa, uma vez que isso seria o ponto de partida para este mapeamento.
Organização das proteínas no neurónio pré-sináptico
Organização das proteínas no neurónio pré-sináptico
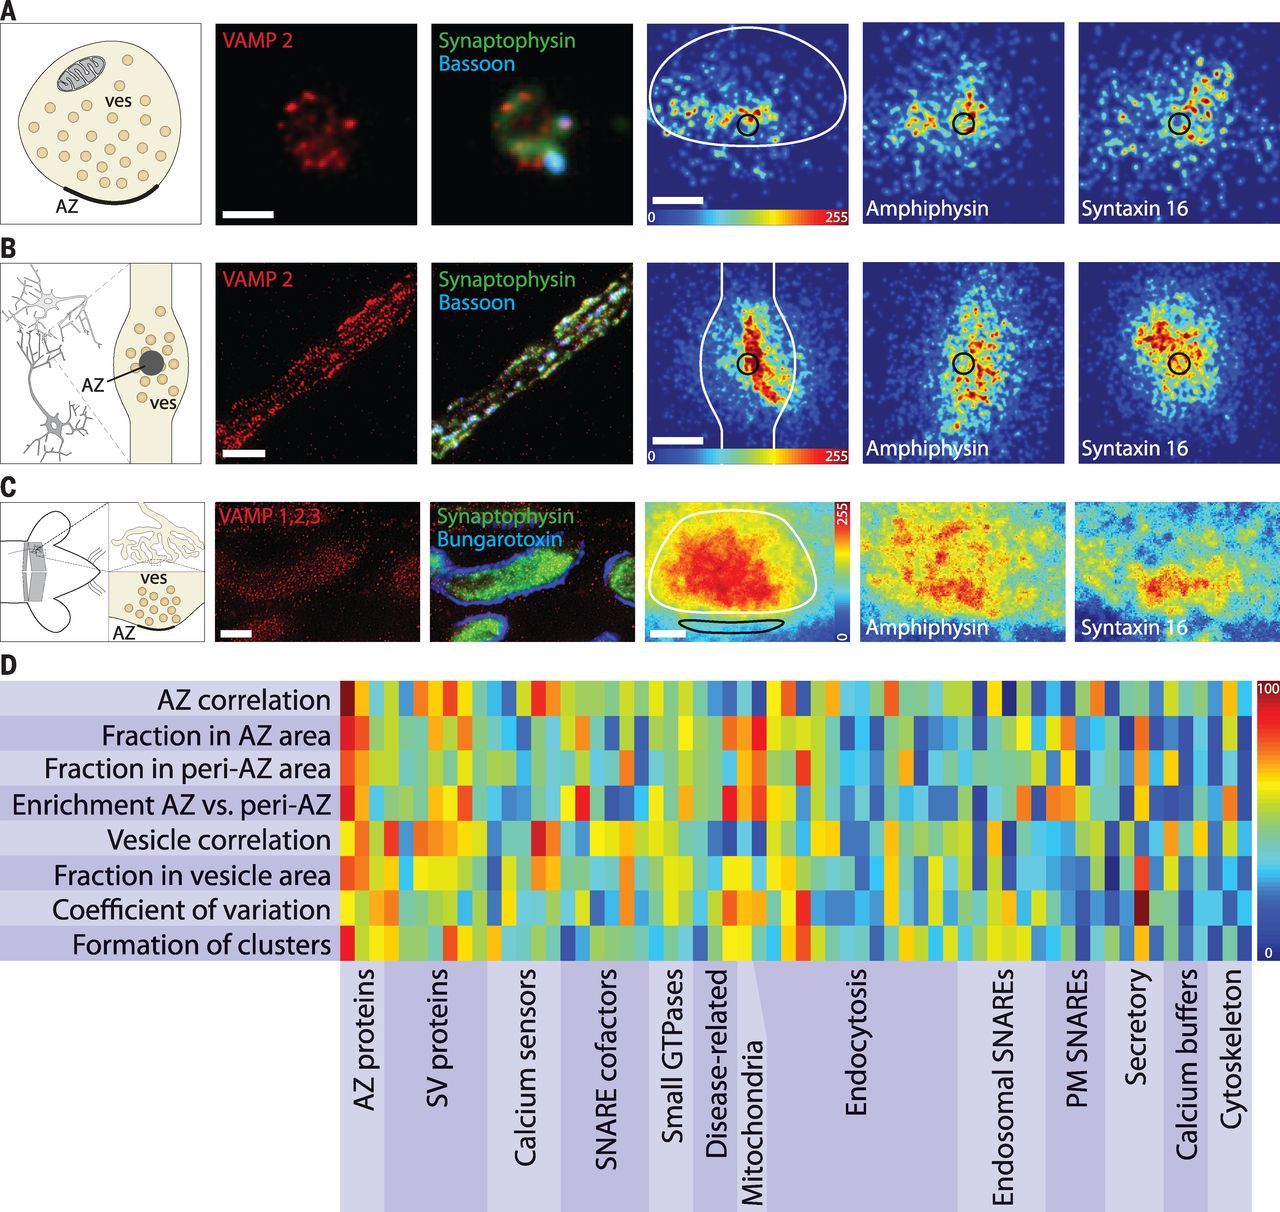
(A) Protein organization in synaptosomes. The scheme indicates an overview of the preparation. AZ, active zone; ves, synaptic vesicles. Purified synaptosomes were immunostained in parallel for the protein of interest, VAMP 2 (red, STED resolution), for an active zone marker, bassoon (blue, confocal resolution), and for a vesicle marker, synaptophysin (green, confocal resolution). The fourth panel shows the relative spatial distribution of VAMP 2 as obtained from average images (several hundred synapses from two independent experiments; see the supplementary materials for further details). The putative outline of the synapse is indicated by the white line, the active zone by the black circle; the relative spatial abundance is color-coded (see color bar). Scale bars are 500 nm (image panels) and 200 nm (fourth panel). The last two panels on the right are density distributions for two additional presynaptic proteins, amphiphysin and syntaxin 16. Scale bar is 200 nm. (B) Protein organization in hippocampal cultures. Details as in (A). Scale bars are 2 μm and 200 nm, respectively. (C) Protein organization in the mouse neuromuscular junction. Instead of immunostaining for bassoon, the active zone position was obtained by labeling postsynaptic acetylcholine receptors with bungarotoxin. All other details as in (A). Scale bars are 2 μm and 500 nm, respectively. Imaging data for all the other proteins are provided in fig. S6. (D) Different spatial parameters were measured for each of the 62 proteins we imaged, as indicated by the labeling of the rows. Parameter values were normalized to the maximum (100%). All values are indicated according to the color scale (right). The proteins are grouped according to functional categories: active zone proteins (bassoon, piccolo, and RIM1), synaptic vesicle proteins (synaptophysin, VGlut 1/2, VAMP 2, VAMP 1, SV2 A/B, synapsin I/II, and synaptogyrin 1), calcium sensor proteins (synaptotagmin 2, synaptotagmin 1, synaptotagmin 7, doc 2A/B, and calmodulin), SNARE cofactors (CSP, Munc13a, Munc18a, NSF, α-SNAP, and complexin 1/2), small guanosine triphosphatases (GTPases) (Rab3, Rab5, and Rab7), disease-related proteins (α/β-synuclein, APP, and β-secretase), mitochondrial proteins (VDAC), endocytosis proteins (AP-2 mu2, SGIP1, synaptojanin, epsin 1, clathrin heavy chain, clathrin light chain, dynamin 1,2,3, endophilin I,II,III, amphiphysin, Hsc70, intersectin 1, PIPK Iγ, AP 180, and syndapin 1), endosomal SNAREs (syntaxin 13, syntaxin 16, syntaxin 7, syntaxin 6, Vti1a, and VAMP4), plasma membrane SNAREs (syntaxin 1, SNAP 23, SNAP 25, and SNAP 29), general secretory proteins (CAPS, SCAMP 1, SGTα, and vATPase a1), calcium buffer proteins (calbindin, calretinin, and parvalbumin), and cytoskeletal proteins (actin, septin 5, and tubulin). Fonte: Science
Para perceber a localização de cada uma das famílias de proteínas, procedeu-se à marcação das mesmas, por forma a obter um mapa de densidade de cada proteínas que permitisse perceber o padrão de distribuição das proteínas em causa.
Resultado Final
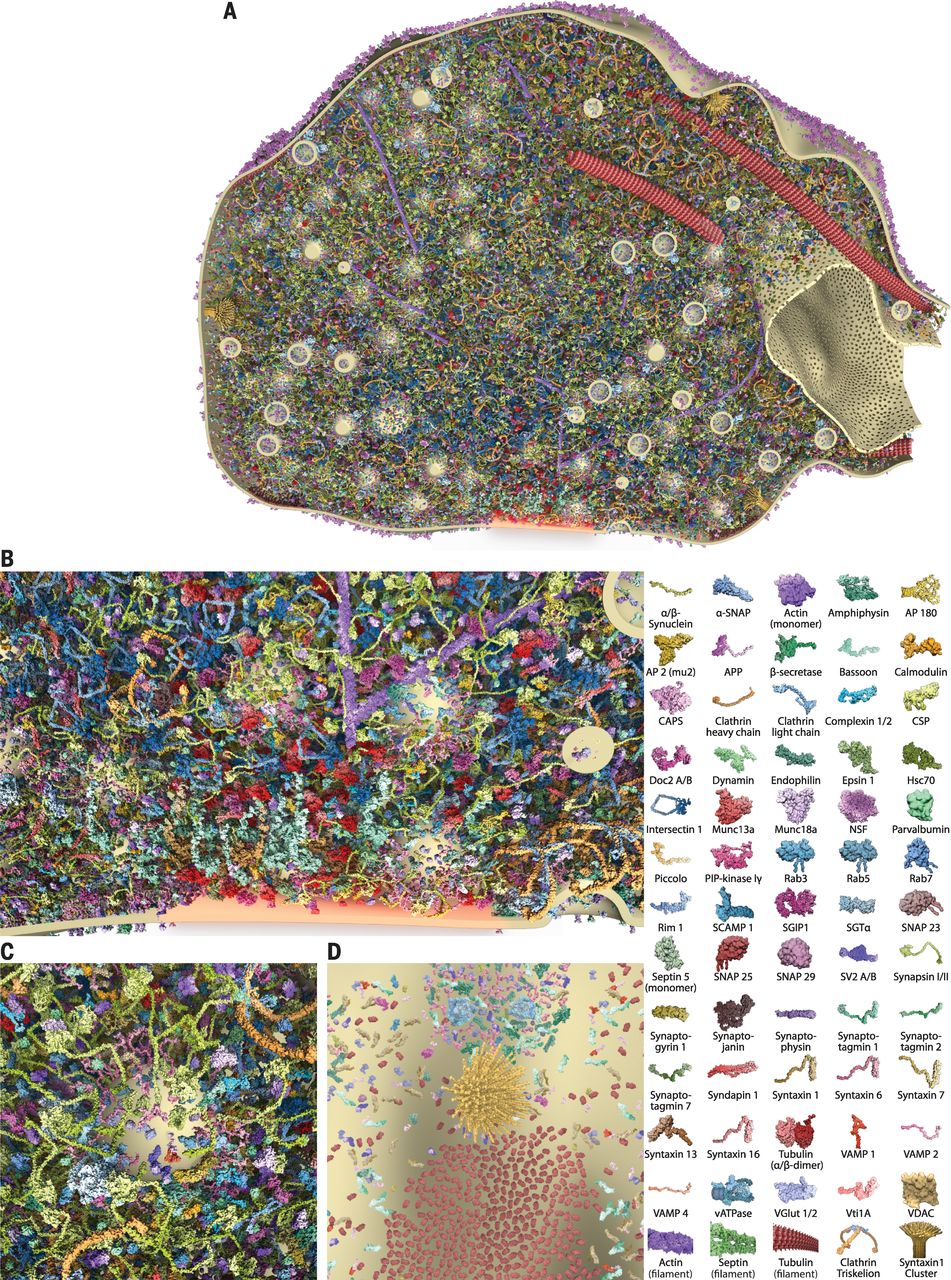
O resultado final foi obtido por bioinformática, recorrendo às estruturas das proteínas em questão e dispondo-as ao longo de uma terminação pré-sináptica com base nos resultados de localização e distribuição obtidos anteriormente. O resultado é a imagem abaixo que é capa da revista Science este mês.

(A) A section through the synaptic bouton, indicating 60 proteins. The proteins are shown in the copy numbers indicated in tables S1 and S2 and in positions determined according to the imaging data (Fig. 2 and fig. S6) and to the literature (see fig. S6 for details). (B) High-zoom view of the active zone area. (C) High-zoom view of one vesicle within the vesicle cluster. (D) High-zoom view of a section of the plasma membrane in the vicinity of the active zone. Clusters of syntaxin (yellow) and SNAP 25 (red) are visible, as well as a recently fused synaptic vesicle (top). The graphical legend indicates the different proteins (right). Displayed synaptic vesicles have a diameter of 42 nm.
Fonte: Science
Sinapse neuronal 3D from FCiências on Vimeo.